Visitor Traffic Analysis at the Trade Show Booth
How many visitors actually visited your booth
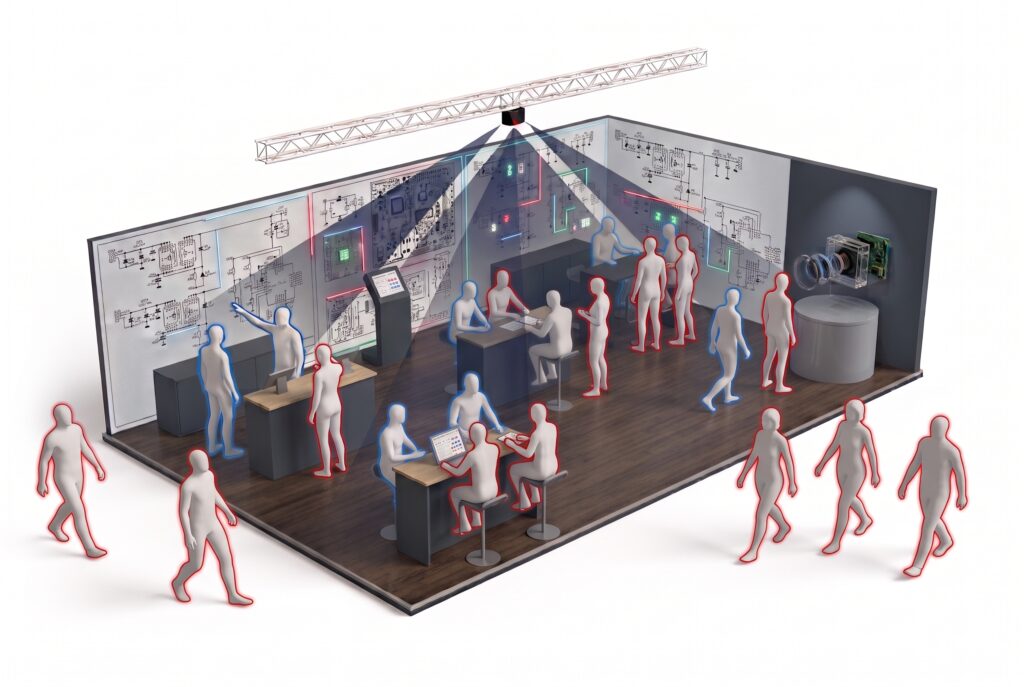
Scan2Lead tracks contacts and leads – people who spoke with your team. Visitor traffic analysis is the perfect complement to your reporting:
- How many people visited your booth or walked by?
- What exactly caught the visitors’ attention?
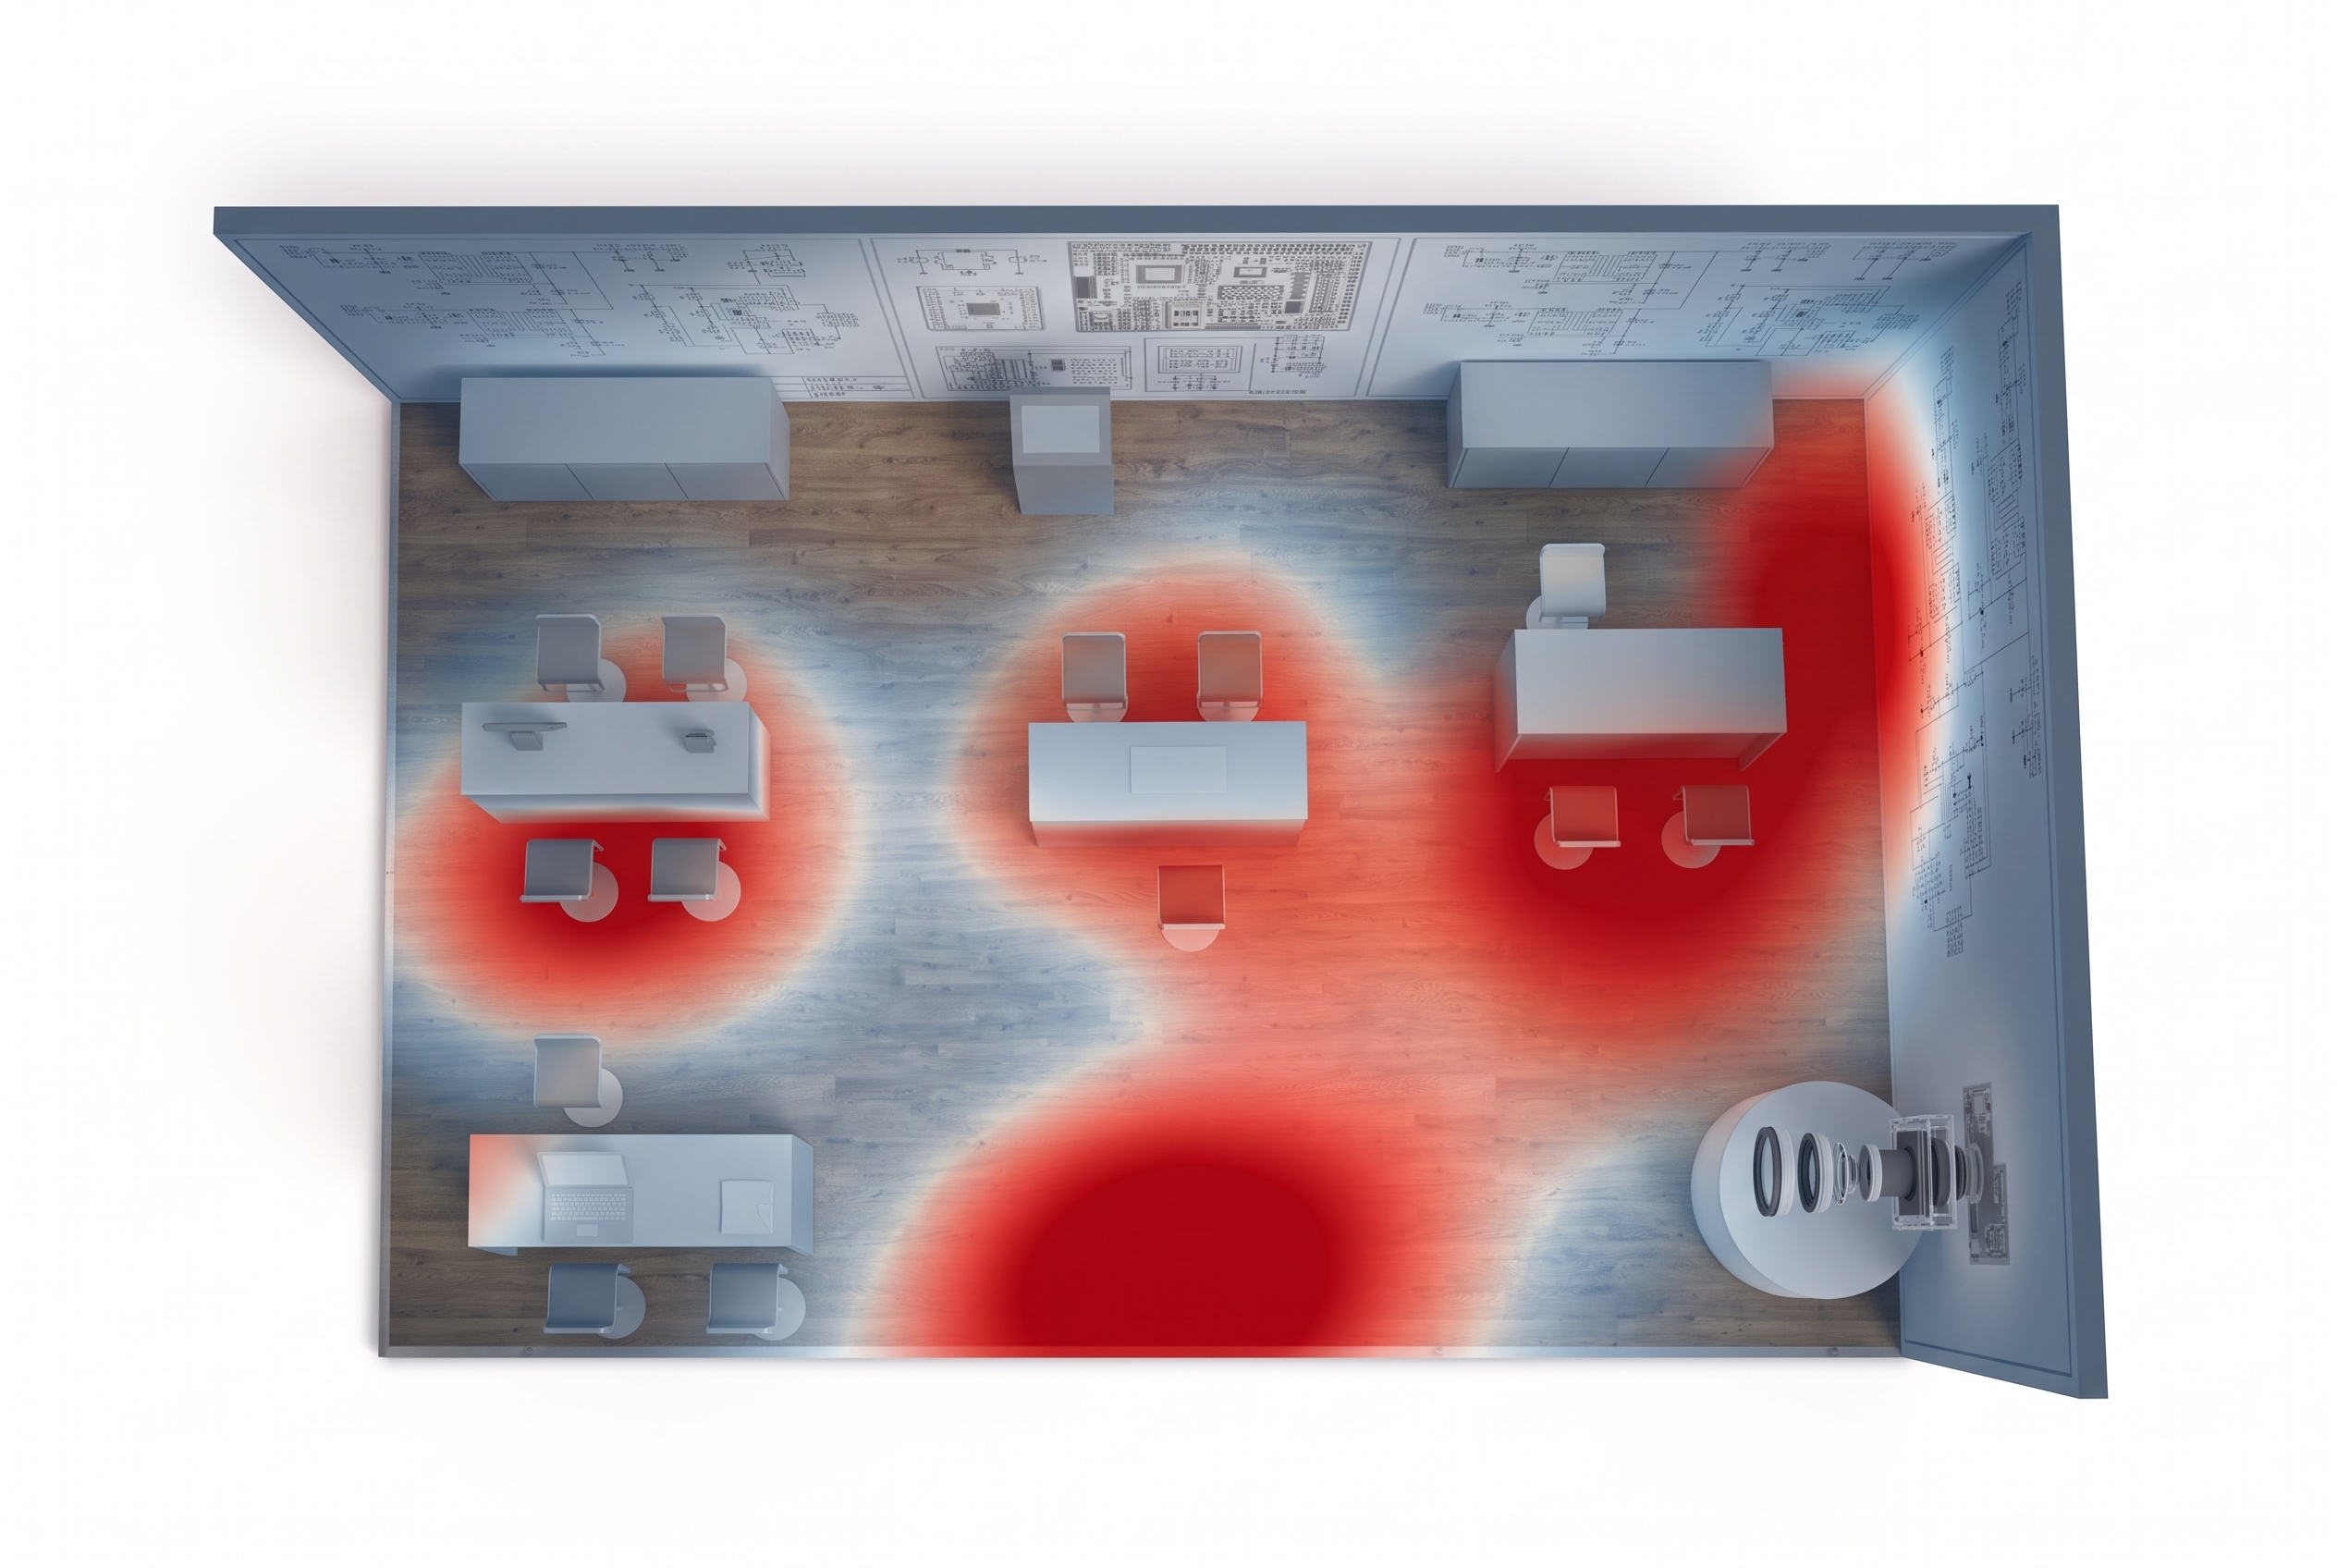
- Which areas and exhibits at your booth achieved the desired effect?
Measurements are taken anonymously, without facial recognition and without personal data.
Use Cases for Frequency Analysis
When is frequency analysis the right solution for you?
Demonstrate success
You’re thinking long-term and want to know which areas of your trade show booth attract the most attention and which spaces you might be able to use more effectively in the future.
Improve Communication
You want to see how many visitors leave without interacting with the booth staff, and at what times your team needs additional support or can be scheduled more efficiently.
Defend Budgets
You need reliable figures for management and other stakeholders that go beyond the overall number of visitors to the trade show and the number of leads generated.
Your benefits
Measure instead of Estimating
Anonymous
The measurement system operates without facial recognition and without using personal data. This makes it 100% GDPR-compliant.
No extra work for your team
Our trusted partner will handle the setup and operation. Your booth team will work as usual and won’t have to worry about a thing.
Connects with Your Leads
You can compare the number of booth visitors to the number of leads you captured. This gives you the capture rate, the percentage of your booth visitors who actually became captured leads.
How Frequency Analysis Works
Four Steps to Analysis
Submit your inquiry using the form on this page.
Free initial consultation and quote from our trusted partner.
Setup of the measurement equipment at the booth; measurements taken throughout the entire duration of the trade show.
Post-trade show analysis in the form of a PDF report and an online dashboard.
Your Evaluation
You will receive these key figures, analyses, and recommendations
The scope of the analysis depends on the size of the booth and your specific questions. In particular, the analysis includes:
- Concrete recommendations for action based on key metrics
- Actual visitors to your booth and the length of their stay
- Distribution throughout the day and during peak hours as a basis for workforce planning
- Separating booth staff from visitors to ensure that the numbers remain reliable
- Zones and exhibits, with dwell times specified for each area, based on sufficient floor space and installation height
- Comparison across multiple trade shows, once multiple appearances have been recorded
Numbers Lead to Decisions
What You Decide Based on the Results
In practice, these metrics regularly lead to these three decisions regarding the next performance.
Reception and Entrances
Where visitors enter the booth and where they stop first indicates whether the reception area and the greeting are in the right place.
Area and Exhibits
Areas where visitors spend only a short time can be made smaller, used differently, or set aside for more prominent exhibits.
Staff and Hours
Peak times and periods without staff coverage show when and how many people are needed at the booth and when breaks are less than ideal.
Enquire now for your next trade fair
Please let us know the size of your stand and the trade fair, and we will forward your enquiry to our trusted partner. The enquiry is non-binding.
For Your Booth
The Right Measurement for Every Booth Size
The size of the stand determines which questions can be answered effectively. In addition to the surface area, the mounting height is particularly crucial, because the higher a sensor is mounted, the larger the area it covers.
Under 70 m²
Usually fitted to the end wall
70 to 150 m²
Usually mounted on a crossbar
Over 150 m²
High Crossbar
Frequently Asked Questions
Frequently Asked Questions About Frequency Analysis
Would you like to know how the measurement process works at the booth? Here you’ll find answers to the most frequently asked questions.
You fill out the form, we review your information, and forward the request to the Trusted Partner. The partner will contact you directly – usually within two to three business days – and provide a preliminary quote or price estimate. Your contractual partner for the measurement is the Trusted Partner, not Scan2Lead.
We work with specialized providers of visitor tracking services. Scan2Lead forwards the request and establishes the connection.
The price depends on the size of the booth, the number of exhibition days, and your specific needs. As a general guideline, services of this kind often account for one to three percent of the booth budget. You will receive a binding quote from your Trusted Partner.
Yes. No facial recognition takes place, and no personal data is collected. The procedures used are designed for anonymous data collection.
No, not with anonymous traffic analysis, but with Scan2Lead’s contact and lead capture feature, which is a professional lead-tracking solution for trade shows.
No special permission is generally required to take measurements within your own booth space. If you also wish to measure the frequency in the aisle, this involves common areas and generally requires the organizer’s approval.
The Trusted Partner will handle this, working with your booth builder depending on the setup. Setup usually takes place the day before the trade show and takes just a few hours. Your booth team won’t need to staff the booth during the trade show.
Yes. For booths smaller than 70 m², the number of visitors, stop rate, and dwell time are usually tracked using a counting line. Analyses of individual zones generally require more space and an installation height of over three meters.
Depending on your setup, you’ll be able to view key metrics even while the trade show is in progress. The complete analysis will be available a few business days after the trade show ends.
Yes. The number of booth visitors and the leads you’ve recorded in Scan2Lead together make up the capture rate.